Confusing Stats Terms Explained: Heteroscedasticity (Heteroskedasticity)
 Jeremy Taylor |
  Monday, April 22, 2013 at 7:00AM
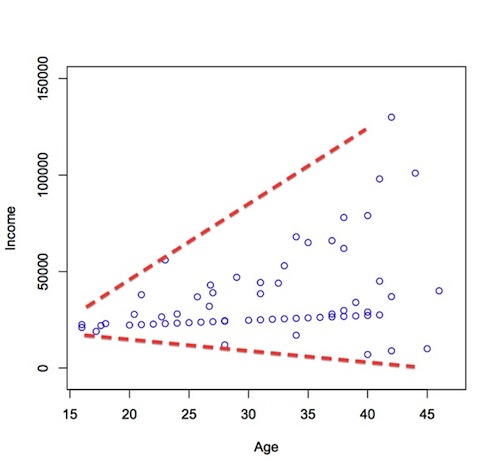
 A scatterplot of these variables will often create a cone-like shape, as the scatter (or variability) of the dependent variable (DV) widens or narrows as the value of the independent variable (IV) increases. The inverse of heteroscedasticity is homoscedasticity, which indicates that a DV's variability is equal across values of an IV.
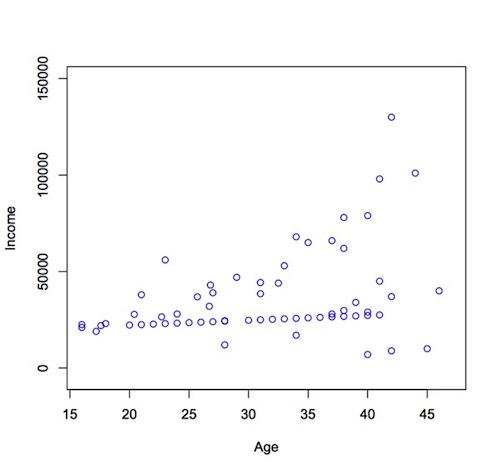
For example: annual income might be a heteroscedastic variable when predicted by age, because most teens aren't flying around in G6 jets that they bought from their own income. More commonly, teen workers earn close to the minimum wage, so there isn't a lot of variability during the teen years. However, as teens turn into 20-somethings, and 20-somethings into 30-somethings, some will tend to shoot-up the tax brackets, while others will increase more gradually (or perhaps not at all, unfortunately). Put simply, the gap between the "haves" and the "have-nots" is likely to widen with age.
If the above where true and I had a random sample of earners across all ages, a plot of the association between age and income would demonstrate heteroscedasticity, like this:


By the way, I have no real data behind this example; this is just a hypothetical situation, though it does seem logical.
Heteroscedasticity is most frequently discussed in terms of the assumption of parametric analyses (e.g. linear regression). More specifically, it is assumed that the error (a.k.a residual) of a regression model is homoscedastic across all values of the predicted value of the DV. Put more simply, a test of homoscedasticity of error terms determines whether a regression model's ability to predict a DV is consistent across all values of that DV. If a regression model is consistently accurate when it predicts low values of the DV, but highly inconsistent in accuracy when it predicts high values, then the results of that regression should not be trusted.
I want to re-iterate that the concern about heteroscedasticity, in the context of regression and other parametric analyses, is specifically related to error terms and NOT between two individual variables (as in the example of income and age). This is a common misconception, similar to the misconception about normality (IVs or DVs need not be normally distributed, as long as the residuals of the regression model are normally distributed). Now that you know what heteroscedasticity means, now try saying it five times fast!
I hope you found this helpful. What stats terms do you find confusing?
Editorial Note: Stats Make Me Cry is owned and operated by Jeremy J. Taylor. The site offers many free statistical resources (e.g. a blog, SPSS video tutorials, R video tutorials, and a discussion forum), as well as fee-based statistical consulting and dissertation consulting services to individuals from a variety of disciplines all over the world.


Reader Comments (2)
Great blog I just discovered! i'm now exploring your postings right now. A question on this topoc: how should a scatter plot Look like when testing for h. in a linear regression model? What would be the distributions of residuals in the x axis?
Hi Daniel,
Ideally there would be approximately equal vertical spread of the residuals across values of the x-axis (predicted values). In terms of a histogram, it's ideal if the residuals are normally distributed (indicating multivariate normality). I hope that helps!