Next Upcoming Google+ Hangout: Tuesday, August 27 @ 7PM (CST) - To Participate CLICK HERE

Help Me, Help You...
This form does not yet contain any fields.

    Stats Make Me Cry is a place to share ideas, find answers to your stats questions, and obtain statistical consulting, when necessary. Look around, tell a friend, and come back soon! For in-depth data analysis help, check out my comprehensive statistical consulting and dissertation consulting services. I can help if you are a graduate student, someone that is ABD (All But Dissertation), or a professional looking for some statistical perspective. 

    Latest SPSS Video Tutorial:
    How to Create APA Formatted Tables in SPSS
    Latest R Video Tutorial:
    Basics of Working With Data in R


    Entries in APA (2)

    Tuesday
    Dec182012

    How to Create APA Style Graphs and Then Teach SPSS to Do it Automatically!

    In the strictest sense, APA style discourages the use of color in graphics, stipulating that it be used only when it is "absolutely necessary". Consequently, most universities and dissertation committees also discourage (or downright forbid) the use of color graphics in dissertation manuscripts. Personally, i find this irritating, as I think most graphical representations of data can be made more clear with the appropriate use of color. However, I suppose the guideline is meant to provide uniformity and consistency across manuscripts, which is understandable.

    Unfortunately, if you use SPSS you've probably already discovered that it produces graphics in color by default. Not to worry, your graphs can be changed easily. Better yet, you can make simple adjustments to your SPSS settings that will force the program to create APA-compliant (i.e. black & white) graphics in all output! Here is how you do it:
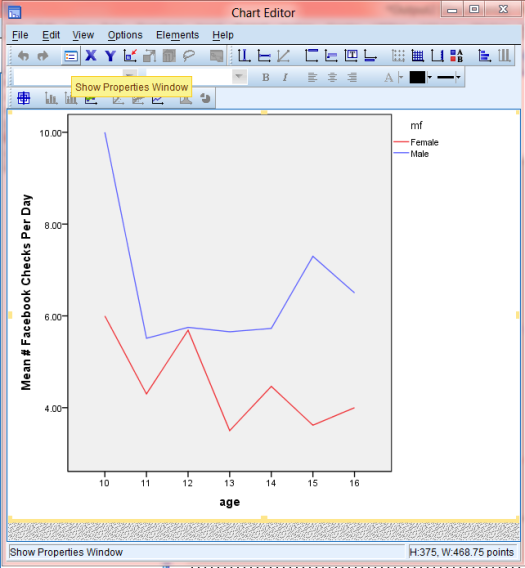
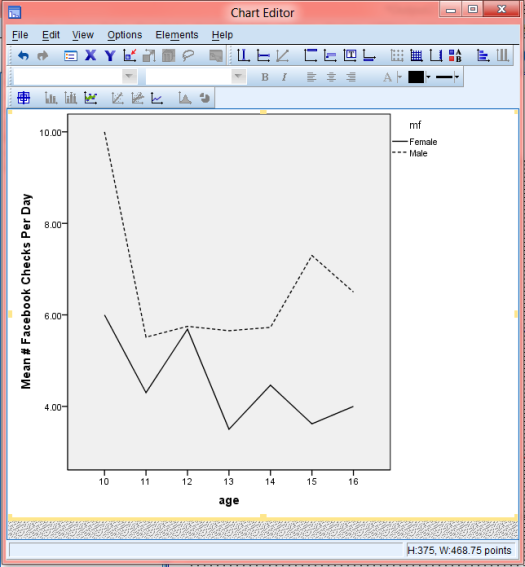
    Color Graph- Non-APAAPA-Graph

    Click to read more ...

    Thursday
    Feb032011

    How to make SPSS produce all tables in APA format automatically!

    Updated on Wednesday, June 8, 2011 at 3:43PM by Registered CommenterJeremy Taylor

    Formatting a graph that was exported from SPSS to Microsoft Word can be an absolute pain. Since neither program is known for it's simplicity or "user-friendliness", the interaction between the two can be predictably tedious and frustrating. The process of converting a standard SPSS table to APA format might be bearable, when you are talking about a single table, but can become overwhelming when you have an entire manuscript worth of tables. Fortunately, a few minor alterations to your SPSS settings can make SPSS do most of the heavily lifting for you, making SPSS automatically produce tables that closely resemble APA format and cutting down your formatting time by as much as 90%!

    APA Format Table Example Before and After

    Click to read more ...