The email sent will contain a link to this article, the article title, and an article excerpt (if available). For security reasons, your IP address will also be included in the sent email.
In today's blog entry, I will walk through the basics of conducting a repeated-measures MANCOVA in SPSS. I will focus on the most basic steps of conducting this analysis (I will not address some complex side issues, such as assumptions, power…etc). If you find yourself with lingering questions after walking through this blog, feel free to leave questions in the "comments" section, or visit the MANCOVA section of my discussion forum to find answers and/or ask questions of your own. Full disclosure: the example data used is from the SPSS sample/help files, and it can be downloaded below.
Let's get started:
Repeated-Measures MANCOVA is used to examine how a dependent variable (DV) varies over time, using multiple measurements of that variable, with each measurement separated by a given period of time. In addition to determining whether the DV itself varies, a MANCOVA can also determine wether other variables are predictive of variability in the DV over time. If that wasn't crystal clear, don't worry, just keep reading.
Repeated-Measures MANCOVA Example:
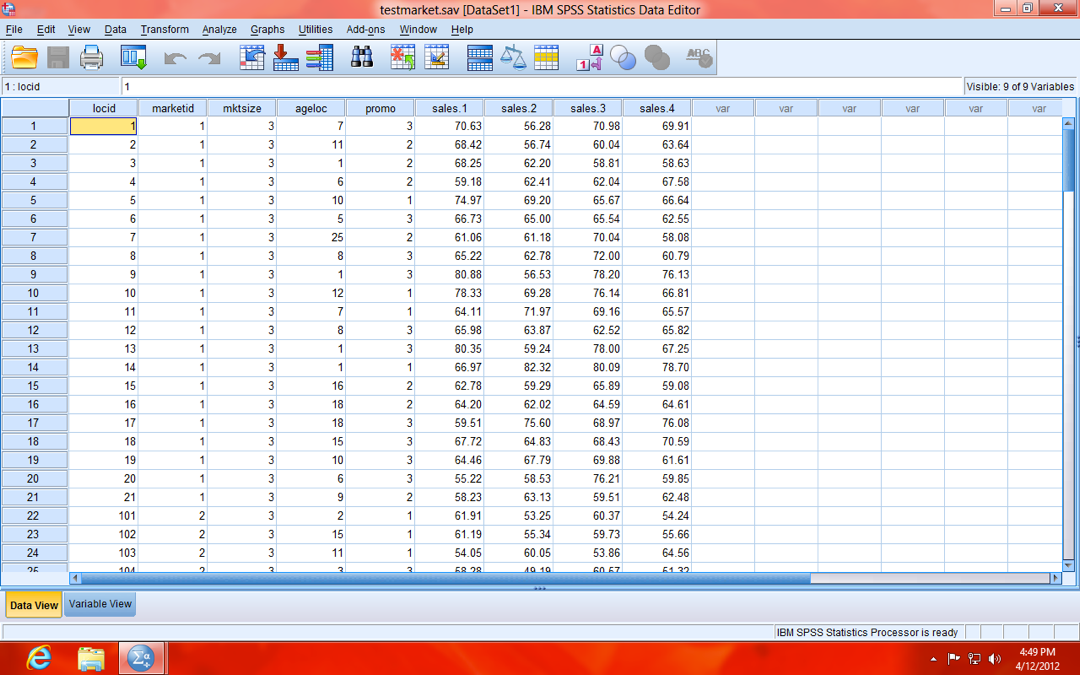
In our example, your local stats store Stats "R" Us launched a marketing campaign, with three different strategies (variable name: promo; value labels: Strategy A, Strategy B, Strategy C). Stats "R" Us launched campaigns in markets of three different sizes (variable name: mktsize; value labels: Small, Medium, and Large), and measured the sales in each store every three months over the course of one year (4 time points; variable names: sales.1, sales.2, sales.3, and sales.4; see data below).

NOTE: Sales are scaled in "thousands" (e.g. 70.63 is actually $70,630). Also, your data should be in person-level (a.k.a. "wide") format (as opposed to person-period, a.k.a. "long", format), meaning each row of data is a single case (store, in our example). If it were in person-period (long) format, each case (store) would have the number of rows equal to the number of repeated measures (four, in our example), because the repeated measures (sales.1, sales.2, sales.3, and sales.4) would be stacked to form a single variable (Sales).

 Return to Article
